Flu Vaccination – Statistics
Published on: 14th October 2015 | Updated on: 8th April 2024
The rest of this section contains data on the provision of the Flu Vaccination Advanced Service that has been provided to Community Pharmacy England by clinical system suppliers.
The Excel document below contain information on the number of flu vaccinations administered as part of the community pharmacy Flu Vaccination Service 2023/24 which have been entered into the PharmOutcomes and Sonar systems only.*
Daily flu vaccination data (updated 8th April 2024)
This data shows the eligibility groups of patients who have been vaccinated in participating community pharmacies.
| Vaccination eligibility group | PharmOutcomes | Sonar | Total | Percentage of total vaccinations |
| 65 years and over | 1,940,891 | 279,391 | 2,220,282 | 61.8% |
| Chronic respiratory disease | 219,664 | 39,421 | 259,085 | 7.2% |
| Diabetes | 144,118 | 41,532 | 185,650 | 5.2% |
| Carer | 190,253 | 33,501 | 223,754 | 6.2% |
| Fronline Health and Social care workers | 130,963 | 19,925 | 150,888 | 4.2% |
| Immunosuppression | 181,629 | 32,097 | 213,726 | 6.0% |
| Household contact of immunocompromised individual | 83,031 | 17,463 | 100,494 | 2.8% |
| Chronic heart disease | 67,973 | 17,116 | 85,089 | 2.4% |
| Pregnant woman | 21,788 | 6,695 | 28,483 | 0.8% |
| Chronic neurological disease | 33,231 | 6,561 | 39,792 | 1.1% |
| Morbid obesity | 20,720 | 2,965 | 23,685 | 0.7% |
| Learning disability | 18,626 | 2,884 | 21,510 | 0.6% |
| Health and social care workers employed through Direct Payment of Personal Health Budget | 3,838 | 473 | 4,311 | 0.1% |
| Chronic kidney disease | 9,788 | 1,979 | 11,767 | 0.3% |
| Chronic liver disease | 5,859 | 1,520 | 7,379 | 0.2% |
| Asplenia or splenic dysfunction | 3,262 | 626 | 3,888 | 0.1% |
| Hospice worker | 2,969 | 361 | 3,330 | 0.1% |
| Person in long-stay residential care home/care facility | 6,901 | 1,819 | 8,720 | 0.2% |
Updated 8th April 2024
| Location | Total | Percentage of total vaccinations |
| Pharmacy | 2,979,063 | 96.4% |
| Onsite at a Pharmacy run LVS | 16,975 | 0.6% |
| Onsite at vaccination centre | 64,470 | 2.2% |
| Care home | 11,139 | 0.4% |
| Residential Facility | 2,432 | 0.1% |
| Home or Housebound patient | 9,684 | 0.3% |
| Not Recorded | 1,728 | 0.1% |
Updated 8th April 2024
| Vaccination delivered under | Total | Percentage of total vaccinations |
| Patient Group Direction | 2,621,211 | 85% |
| National Protocol | 464,293 | 15% |
Updated 8th April 2024
Previous years data
The number of flu vaccinations administered by community pharmacists under the NHS Advanced service grew by 3.2% in 2022/23 compared to the previous year, with 5,007,578 administrations being claimed by the end of March 2023 (NHSBSA data).
The rest of this section contains data on the provision of the Flu Vaccination Advanced Service that has been provided to Community Pharmacy England by clinical system suppliers.
Flu vaccination data 2022-23 (excel)
Flu vaccination data 2022-23 (PDF)
Patient eligibility group data from PharmOutcomes and Sonar for 2022/23
This data shows the eligibility groups of patients who have been vaccinated in participating community pharmacies.
Some contractors are not able to use or have decided not to use electronic systems to record the administration of vaccines. Therefore, this data does not cover all patients vaccinated during the 2022/23 service.
| Vaccination eligibility group | PharmOutcomes
3rd April 23 |
Sonar
31 Jan 23 |
Total | Percentage of total vaccinations |
| 65 years and over | 2,077,637 | 263,645 | 2,341,282 | 47.5% |
| 50 to 64 years old | 1,342,992 | 167,606 | 1,510,598 | 30.7% |
| Chronic respiratory disease | 230,487 | 40,244 | 270,731 | 0.7% |
| Diabetes | 115,765 | 35,786 | 151,551 | 3.1% |
| Carer | 132,154 | 24,211 | 156,365 | 3.2% |
| Fronline Health and Social care workers | 103,764 | 17615 | 121,379 | 2.5% |
| Immunosuppression | 92,637 | 19,388 | 112,025 | 2.3% |
| Household contact of immunocompromised individual | 51,320 | 10,799 | 62,119 | 1.3% |
| Chronic heart disease | 42,580 | 11499 | 54,079 | 1.1% |
| Pregnant woman | 29,955 | 7824 | 37,779 | 0.8% |
| Chronic neurological disease | 24,359 | 4,625 | 28,984 | 0.6% |
| Morbid obesity | 20,542 | 2,721 | 23,263 | 0.5% |
| Learning disability | 19,279 | 2,826 | 22,105 | 0.4% |
| Health and social care w orkers employed through Direct Payment of Personal Health Budget | 9,203 | 587 | 9,790 | 0.2% |
| Chronic kidney disease | 7,236 | 1529 | 8,765 | 0.2% |
| Chronic liver disease | 4,514 | 1,181 | 5,695 | 0.1% |
| Asplenia or splenic dysfunction | 3,181 | 554 | 3,735 | 0.1% |
| Hospice w orker | 2,951 | 420 | 3,371 | 0.1% |
| Person in long-stay residential care home/care facility | 3,646 | 821 | 4,467 | 0.1% |
Location of service data from PharmOutcomes
| Location | Total | Percentage of total vaccinations |
| Pharmacy | 4,042,924 | 93.7% |
| Onsite at a Pharmacy run LVS | 66,010 | 1.5% |
| Onsite at vaccination centre | 181,029 | 4.2% |
| Care home | 10,565 | 0.2% |
| Residential Facility | 2,475 | 0.1% |
| Home or Housebound | 6,533 | 0.1% |
| Not Recorded | 4,663 | 0.1% |
Analysis of Service delivered under from PharmOutcomes
| Vaccination delivered under | Total | Percentage of total vaccinations |
| Patient Group Direction | 3,843,797 | 89.1% |
| National Protocol | 470,388 | 10.9% |
Influenza vaccine uptake – UKHSA
The UK Health Security Agency (UKHSA) publishes official statistics on influenza vaccine uptake with provisional data for 2022 to 2023 given below, compared to the final end of season data for the preceding 4 years.
The number of flu vaccinations administered by community pharmacists under the NHS Advanced service grew by 75% in 2021/22 compared to the previous year, with 4,851,608 administrations being claimed by the end of March 2022 (NHSBSA data).
The rest of this section contains data on the provision of the Flu Vaccination Advanced Service that has been provided to Community Pharmacy England by clinical system suppliers.
The Excel document below contain information on the number of flu vaccinations administered as part of the community pharmacy Flu Vaccination Service 2021/22 which have been entered into the PharmOutcomes and Sonar systems.*
*Sonar data for the number of flu vaccinations administered as part of the community pharmacy Flu Vaccination Service 2021/22 has not been available to report since the start of February 2022.
Some contractors are unable to use or have decided not to use these electronic systems to record the administration of vaccines. Therefore the total number of vaccinations administered by community pharmacists under the national Flu Vaccination Service in 2021/22 will be higher than the number recorded in the Excel document below.
Daily flu vaccination data (last updated 4th April 2022)
Patient eligibility group data from PharmOutcomes and Sonar for 2021/22
This data shows the eligibility groups of patients who have been vaccinated in participating community pharmacies.
Some contractors are not able to use or have decided not to use electronic systems to record the administration of vaccines. Therefore this data does not cover all patients vaccinated during the 2021/22 service.
| Vaccination eligibility group | PharmOutcomes | Sonar | Total | Percentage of total vaccinations |
| 50 to 64 years old | 1,827,759 | 232,672 | 2,060,431 | 45.5% |
| 65 years and over | 1,613,195 | 218,994 | 1,832,189 | 40.4% |
| Chronic respiratory disease | 167,092 | 34,025 | 201,117 | 4.4% |
| Carer | 53,742 | 10,057 | 63,799 | 1.4% |
| Diabetes | 51,575 | 23,249 | 74,824 | 1.7% |
| Social care workers | 42,323 | 11,790 | 54,113 | 1.2% |
| Immunosuppression | 35,417 | 9,440 | 44,857 | 1.0% |
| Pregnant woman | 32,725 | 7,948 | 40,673 | 0.9% |
| Household contact of immunocompromised individual | 26,275 | 6,311 | 32,586 | 0.7% |
| Frontline primary care staff | 20,293 | 10 | 20,303 | 0.4% |
| Morbid obesity | 17,940 | 2,157 | 20,097 | 0.4% |
| Learning disability | 15,257 | 2,356 | 17,613 | 0.4% |
| Chronic neurological disease | 14,769 | 2,893 | 17,662 | 0.4% |
| Chronic heart disease | 13,337 | 4,919 | 18,256 | 0.4% |
| Health and social care workers employed through Direct Payment of Personal Health Budget | 13,824 | 617 | 14,441 | 0.3% |
| Chronic kidney disease | 3,838 | 1,130 | 4,968 | 0.1% |
| Hospice worker | 2,615 | 414 | 3,029 | 0.1% |
| Chronic liver disease | 2,724 | 830 | 3,554 | 0.1% |
| Person in long-stay residential care home/care facility | 2,427 | 406 | 2,833 | 0.1% |
| Asplenia or splenic dysfunction | 2,153 | 448 | 2,601 | 0.1% |
Location of service data from PharmOutcomes
| Location | Total | Percentage of total vaccinations |
| Pharmacy | 3,911,016 | 98.8% |
| Long-stay care home or long-stay residential facility | 18,544 | 0.5% |
| Patient’s home | 4,182 | 0.1% |
| Other | 25,538 | 0.6% |
Analysis of provision to primary care sector staff from PharmOutcomes
| Location | Total* | Percentage of total vaccinations |
| Community Pharmacy | 8,237 | 40.6% |
| Dentistry | 2,698 | 13.3% |
| General Practice | 8,075 | 39.8% |
| Optometry | 1,283 | 6.3% |
The number of flu vaccinations administered by community pharmacists under the NHS Advanced service grew by 62% in 2020/21 compared to the previous year, with 2,766,332 administrations being claimed at the end of March (NHSBSA data).
The Excel and PDF documents below contain information on the number of flu vaccinations administered as part of the community pharmacy Flu Vaccination Service 2020/21 which have been entered into the PharmOutcomes and Sonar systems.
Some contractors are unable to use or have decided not to use these electronic systems to record the administration of vaccines. Therefore the total number of vaccinations administered by community pharmacists under the national Flu Vaccination Service in 2020/21 will be higher than the number recorded in the Excel and PDF documents below.
Flu vaccination data 2020-21 (Excel)
Flu vaccination data 2020-21 (PDF)
Patient eligibility group data from PharmOutcomes and Sonar for 2020/21
This data shows the eligibility groups of patients who have been vaccinated in participating community pharmacies (updated on the 31st March 2021).
Some contractors are not able to use or have decided not to use electronic systems to record the administration of vaccines. Therefore this data does not cover all patients vaccinated during the 20120/21 service.
| Vaccination eligibility group | PharmOutcomes | Sonar | Total | Percentage of total vaccinations |
| 65 years and over | 1,226,610 | 166,730 | 1,393,340 | 53.2% |
| A weakened immune system | 44,919 | 8,780 | 53,699 | 2.1% |
| Adult household contact of immunocompromised individual | 21,837 | 3,519 | 25,356 | 0.7% |
| Adults in long-stay residential care home/care facility | 2,951 | 892 | 3,843 | 0.1% |
| Carer | 87,379 | 13,519 | 100,898 | 3.9% |
| Asplenia or splenic dysfunction | 2,468 | 394 | 2,862 | 0.1% |
| Chronic (long term) respiratory disease | 201,424 | 31,946 | 233,370 | 8.9% |
| Chronic heart disease such as heart failure | 38,032 | 8,341 | 46,373 | 1.8% |
| Chronic kidney disease | 6,107 | 1022 | 7,129 | 0.3% |
| Chronic liver disease | 3,307 | 669 | 3,976 | 0.2% |
| Chronic neurological disease | 19,045 | 3,047 | 22,092 | 0.8% |
| Diabetes | 99,309 | 26,680 | 125,989 | 4.8% |
| Social care staff | 65,200 | 3,151 | 68,351 | 2.6% |
| Hospice worker | 3,967 | 350 | 4,317 | 0.2% |
| Morbid obesity | 11,304 | 1022 | 12,326 | 0.5% |
| Pregnant woman | 17,067 | 4,792 | 21,859 | 0.8% |
| Household contact of shielded patient | 24,188 | 3,667 | 27,855 | 1.1% |
| Learning disability | 7,789 | 1,051 | 8,840 | 0.3% |
| Employed through direct payment of personal health budget | 7,371 | 351 | 7,722 | 0.3% |
| Aged 50-64 | 393,227 | 54,290 | 447,517 | 17.1% |
Location of service data from PharmOutcomes
| Location | Total | Percentage of total vaccinations |
| Pharmacy | 2,224,239 | 98.1% |
| Long-stay care home or long-stay residential facility | 25,254 | 1.1% |
| Patient’s home | 4,386 | 0.2% |
| Community venue | 13,646 | 0.6% |
The number of flu vaccinations administered by community pharmacists under the NHS Advanced service grew by 20% in 2019/20 compared to the previous year, with 1,718,147 administrations being claimed to the end of March (NHSBSA data).
The rest of this page contains data on the provision of the Flu Vaccination Advanced Service that has been provided to Community Pharmacy England by clinical system suppliers.
Flu vaccination data from PharmOutcomes and Sonar for 2019/20
The Excel and PDF documents below contain information on the number of flu vaccinations administered as part of the community pharmacy Flu Vaccination Service 2019/20 which have been entered into the PharmOutcomes and Sonar systems.
Some contractors are unable to use or have decided not to use these electronic systems to record the administration of vaccines. Therefore the total number of vaccinations administered by community pharmacists under the national Flu Vaccination Service in 2019/20 will be higher than the number recorded in the Excel and PDF documents below.
Flu vaccination data 2019/20 accurate 31.03.2020 (Excel)
Flu vaccination data 2019/20 accurate 31.03.2020 (PDF)
Patient eligibility group data from PharmOutcomes and Sonar for 2019/20
This data shows the eligibility groups of patients who have been vaccinated in participating community pharmacies (updated to 3oth March 2020).
Some contractors are not able to use or have decided not to use electronic systems to record the administration of vaccines. Therefore this data does not cover all patients vaccinated during the 2019/20 service.
| Vaccination eligibility group | PharmOutcomes | Sonar | Total |
| 65 years and over | 812815 | 125584 | 938399 (61.6%) |
| A weakened immune system | 35555 | 8668 | 44223 (2.9%) |
| Adult household contact of immunocompromised individual | 14508 | 1890 | 16398 (1.1%) |
| Adults in long-stay residential care home/care facility | 4205 | 746 | 4951 (0.3%) |
| Adults who are in receipt of carers allowance | 32099 | 11416 | 43515 (2.9%) |
| Asplenia or splenic dysfunction | 2294 | 423 | 2717 (0.2%) |
| Chronic (long term) respiratory disease | 159099 | 31192 | 190291 (12.5%) |
| Chronic heart disease such as heart failure | 31763 | 8863 | 40626 (2.7%) |
| Chronic kidney disease | 5061 | 995 | 6056 (0.4%) |
| Chronic liver disease | 2766 | 585 | 3351 (0.2%) |
| Chronic neurological disease | 17653 | 3347 | 21000 (1.4%) |
| Diabetes | 92400 | 31487 | 123887 (8.1%) |
| Health and social care staff | 48291 | 1555 | 49846 (3.3%) |
| Hospice worker | 3144 | 402 | 3546 (0.2%) |
| Morbid obesity | 3299 | 568 | 3867 (0.3%) |
| Pregnant woman | 23512 | 8058 | 31570 (2.1%) |
Flu vaccinations administered by community pharmacists in 2018/19
Community pharmacists in England administered 1,431,538 flu vaccinations to patients under the national NHS Flu Vaccination Service in 2018/19.
The NHS Business Services Authority (NHSBSA) has published the Advanced Service Flu Report 2018/19*, detailing the community pharmacy contractors who signed up to provide the service, as well as the NHS England area, vaccines administered, and drug and fee costs.
The number of community pharmacies that provided the national NHS Flu Vaccination Service in 2018/19 was 9,071 (78.2% of all community pharmacies in England).
The average number of vaccinations carried out by each participating pharmacy was 158, although five contractors greatly exceeded this by completing over 1,000 vaccinations each, with one administering over 2,500 vaccinations.
Compared to the 2017/18 flu season, the NHSBSA figures show that the total number of flu vaccinations administered this year was higher by 87,076 with 84 more contractors having provided the service.
Flu vaccination data from PharmOutcomes, Well, Healthi and Sonar for 2018/19
The Excel and PDF document below contains information on the number of flu vaccinations administered as part of the community pharmacy Flu Vaccination Service 2018/19 which have been entered into the PharmOutcomes, Well, Healthi and Sonar systems.
Please note, as the flu vaccination 2018/19 season has come to an end, these figures are correct as of 1st May 2019.
Some contractors are unable to use or have decided not to use these electronic systems to record the administration of vaccines. Therefore the total number of vaccinations administered by community pharmacists under the national Flu Vaccination Service in 2018/19 will be higher than the number recorded in the Excel and PDF documents below.
Flu vaccination data 2018/19 (Excel)
Flu vaccination data 2018/19 (PDF)
Patient eligibility group data from PharmOutcomes, Well, Healthi and Sonar for 2018/19
This data from shows the eligibility groups of patients who have been vaccinated in participating community pharmacies (updated to 1st April 2019).
Some contractors are not able to use or have decided not to use electronic systems to record the administration of vaccines. Therefore this data does not cover all patients vaccinated during the 2018/19 service.
| Vaccination eligibility group | PharmOutcomes | Sonar | Well | Healthi |
| Aged over 65 | 63.9% | 54.4% | 63% | 79.4% |
| Asplenia/splenic dysfunction | 0.2% | 0.1% | 0.1% | 0.6% |
| Carer | 4.6% | 4.6% | 4.9% | 1.6% |
| Chronic heart disease | 2.6% | 3.8% | 3.3% | 4% |
| Chronic kidney disease | 0.4% | 0.4% | 0.4% | 0.6% |
| Chronic liver disease | 0.2% | 0.3% | 0.2% | 0 |
| Chronic neurological disease | 1.3% | 1.3% | 1.2% | 0.6% |
| Chronic respiratory disease | 12.6% | 13.1% | 13.9% | 5.6% |
| Diabetes | 7.4% | 14.1% | 8% | 3.7% |
| Hospice worker | 0.2% | 0.1% | 0% | 0.6% |
| Household contact of immunocompromised individual | 0.6% | 0.7% | 0.5% | 0.6% |
| Immunosuppression | 2.6% | 3.2% | 2.2% | 1.9% |
| Morbid obesity | 0.2% | 0.2% | 0.1% | 0% |
| Person in long-stay residential or home | 0.2% | 0.3% | 0.2% | 0.3% |
| Pregnant woman | 1.4% | 2.6% | 1% | 0% |
| Social care workers | 1.7% | 0.7% | 0.5% | 0.3% |
Flu vaccinations administered by community pharmacists in 2016/17
Community pharmacists in England administered 950,765 flu vaccinations to patients under the national NHS Flu Vaccination Service in 2016/17.
The NHS Business Services Authority has published the Advanced Service Flu Report 2016/17, detailing the community pharmacy contractors who signed up to provide the service, as well as the NHS England area, vaccines administered, and drug and fee costs.
The number of community pharmacies that provided the national NHS Flu Vaccination Service in 2016/17 was 8,451 (71.2% of all community pharmacies in England).
The average number of vaccinations carried out by each participating pharmacy was 113, although one contractor greatly exceeded this by completing over 1,000 vaccinations.
Compared to the 2015/16 flu season, the NHSBSA figures show that the total number of flu vaccinations administered this year was higher by 355,298 with 1,256 more contractors having provided the service.
Flu vaccination data from PharmOutcomes and Sonar Informatics for 2016/17
The data in the PDF below only contains flu vaccinations administered as part of the 2016/17 service which has been entered into the PharmOutcomes or Sonar Informatics systems. Some contractors are unable to use or have decided not to use either of these electronic systems to record the administration of vaccines. The total number of vaccinations administered is, therefore, higher than the total in the below PDF document.
Flu vaccination data 2016 /17 (PDF)
Patient eligibility group data from PharmOutcomes and Sonar Informatics for 2016/17
This data from shows the eligibility groups of patients who have been vaccinated (Updated to 10th April 2017).
Some contractors are not able to use or have decided not to use either of these electronic systems to record the administration of vaccines. Therefore this data does not cover all patients vaccinated during the 2016/17 service.
| Vaccination eligibility group | PharmOutcomes | Sonar Informatics |
| Aged over 65 | 67% | 56.5% |
| Carer | 3.3% | 3.4% |
| Chronic heart disease | 2.9% | 3.8% |
| Chronic kidney disease | 0.4% | 0.4% |
| Chronic liver disease | 0.2% | 0.2% |
| Chronic neurological disease | 1.2% | 1.2% |
| Chronic respiratory disease | 13% | 13.4% |
| Diabetes | 7.6% | 14.3% |
| Household contact of immunocompromised individual | 0.4% | 0.7% |
| Immunosuppression | 2.1% | 2.8% |
| Person in long-stay residential or home | 0.2% | 0.3% |
| Pregnant woman | 1.4% | 2.7% |
| Splenic dysfunction | 0.2% | 0% |
Number of community pharmacies who provided the service in 2016/17
The number of community pharmacies that provided the national NHS Flu Vaccination Service in 2016/17 was 8,451 (71.2% of all community pharmacies in England).
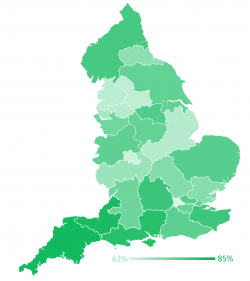
Number of community pharmacies who have signed up to deliver the service in 2016/17 by NHS England area
Below is a heat map showing the percentage of contractors who have signed up to provide the service by NHS England area (data from 23rd September 2016):
Flu vaccinations administered by community pharmacists in 2015/16
Community pharmacists in England provided 595,467 flu vaccinations to patients under the national NHS Flu Vaccination Service in 2015/16.
The NHSBSA has published the Advance Flu Report 2015/16, detailing the community pharmacy contractors who signed up to deliver the service, as well as the NHS England area, name of vaccine administered, manufacturer, quantity, and drug and fee costs.
The average number of vaccinations carried out by each participating pharmacy was 83, although two contractors greatly exceeded this by completing over 1,000 vaccinations each.
Flu vaccination data from Sonar Informatics and PharmOutcomes for 2015/16
The data in the PDF below only contains flu vaccinations administered as part of the 2015/16 service which has been entered into the Sonar Informatics or PharmOutcomes systems. Some contractors were not able to use or decided not to use either of these electronic systems to record the administration of vaccines. The total number of vaccinations administered is, therefore, higher than the total in the below PDF document. Click on ‘Flu vaccinations administered by community pharmacists in 2015/16’ to obtain details of the total number of flu vaccinations administered during the 2015/16 service.
Although the service commenced on 16th September 2015 the announcement that contractors could start providing the service was not made until early in the evening on 16th September therefore the data on the number of flu vaccinations administered starts from 17th September.
Flu vaccination data 2015/16 (PDF)
Patient eligibility group data from Sonar Informatics and PharmOutcomes for 2015/16
This data from PharmOutcomes and Sonar Informatics shows the eligibility groups of patients who have been vaccinated (Sonar updated to 31st January 2016, PharmOutcomes updated to 29th February 2016) for the 2015/16 service. Some contractors were not able to use or decided not to use either of these electronic systems to record the administration of vaccines. Therefore this data does not cover all patients vaccinated during the 2015/16 service.
| Vaccination eligibility group | PharmOutcomes | Sonar Informatics |
| Aged over 65 | 62.2% | 56.6% |
| Carer | 4.1% | 4.1% |
| Chronic heart disease | 3.0% | 3.8% |
| Chronic kidney disease | 0.4% | 0.3% |
| Chronic liver disease | 0.3% | 0.3% |
| Chronic neurological disease | 1.3% | 1.0% |
| Chronic respiratory disease | 14.9% | 13.5% |
| Diabetes | 8.4% | 14.3% |
| Household contact of immunocompromised individual | 0.5% | 0.7% |
| Immunosuppression | 2.4% | 2.4% |
| Person in long-stay residential or home | 0.2% | 0.5% |
| Pregnant woman | 2.2% | 2.4% |
| Splenic dysfunction | 0.2% | 0.2% |
Number of community pharmacies who provided the service in 2015/16
The number of community pharmacies who provided the national NHS Flu Vaccination Service in 2015/16 was 7,195 (60.9% of all community pharmacies in England).
Number of community pharmacies who provided the service in 2015/16 by NHS England area
Below is a heat map showing the percentage of community pharmacies that provided the national NHS Flu Vaccination Service in 2015/16 by NHS England area:
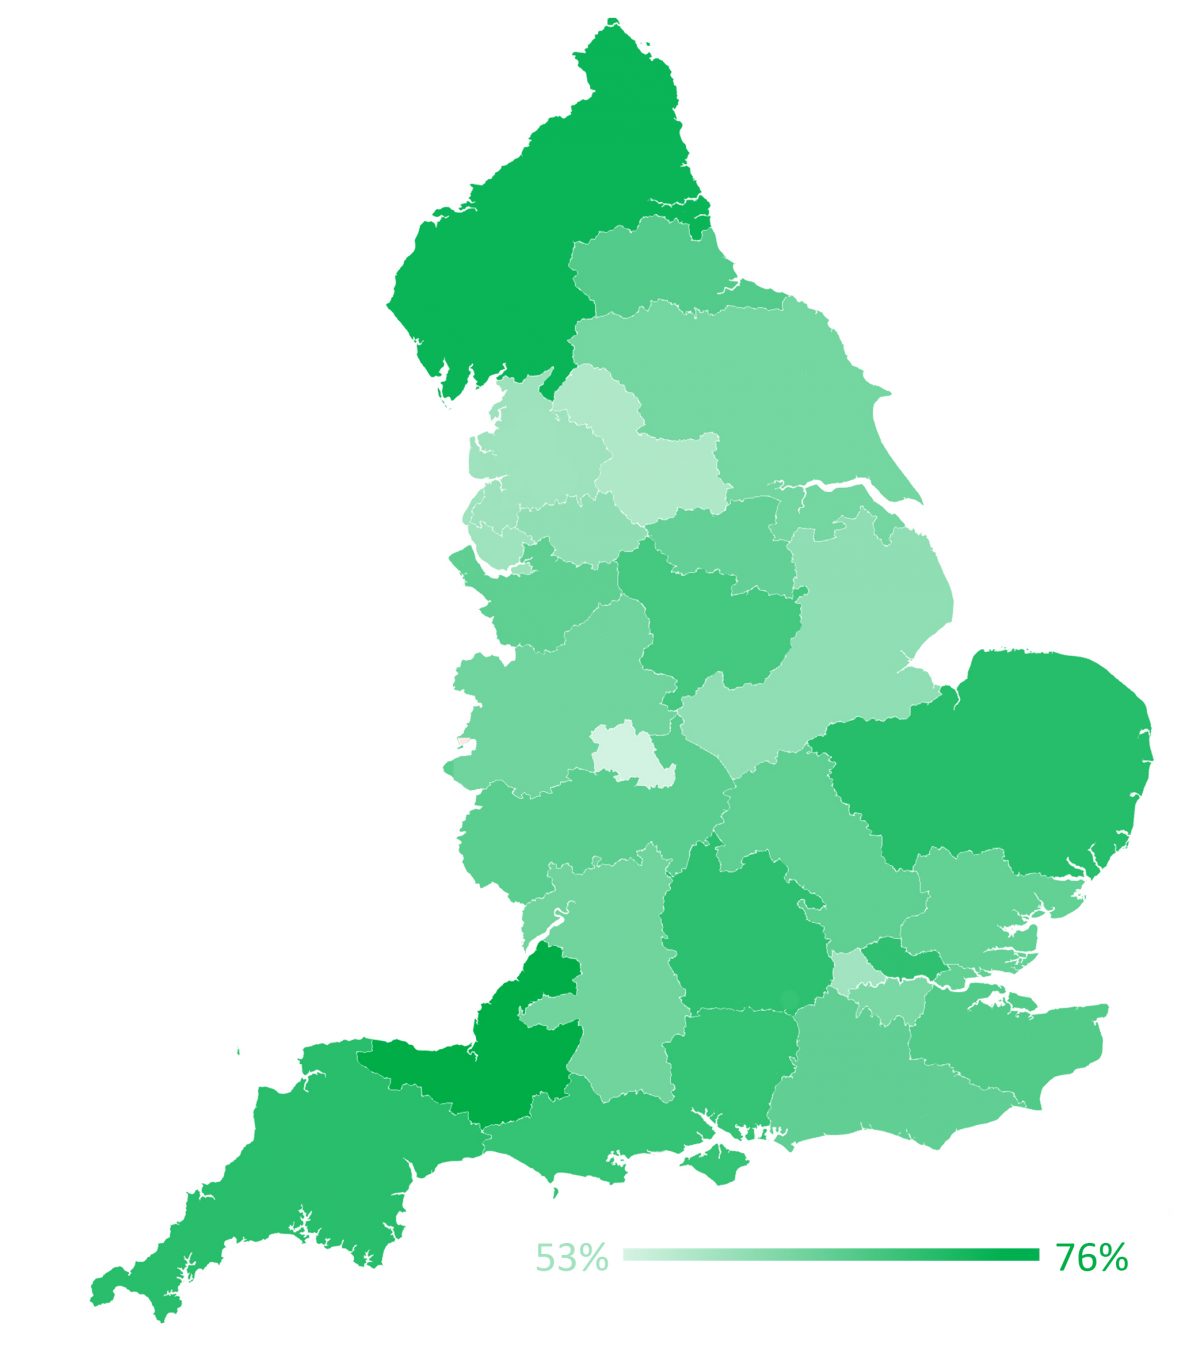
The table below shows the number and percentage of community pharmacies that provided the national NHS Flu Vaccination Service in 2015/16 by NHS England area.
| NHS England area | Number of community pharmacies | Number of community pharmacies providing flu vaccinations |
% |
| Arden, Herefordshire & Worcestershire | 332 | 209 | 63 |
| Bath, Gloucestershire, Swindon & Wiltshire | 267 | 161 | 60 |
| Birmingham & The Black Country | 645 | 341 | 53 |
| Bristol, North Somerset, Somerset & South Gloucestershire | 294 | 223 | 76 |
| Cheshire, Warrington & Wirral | 302 | 188 | 62 |
| Cumbria, Northumberland & Tyne and Wear | 453 | 330 | 73 |
| Derbyshire & Nottinghamshire | 429 | 281 | 66 |
| Devon, Cornwall & Isles of Scilly | 337 | 233 | 69 |
| Durham, Darlington & Tees | 271 | 173 | 64 |
| East Anglia | 464 | 322 | 69 |
| Essex | 337 | 209 | 62 |
| Greater Manchester | 704 | 397 |